The Revenge of the Data Scientist
Is the heyday of the data scientist over? The Harvard Business Review once called it “The Sexiest Job of the 21st Century.”1 In tech, data scientist roles were often among the best paid.2 The job also demanded an unusual mix of skills:
Data Scientist (n.): Person who is better at statistics than any software engineer and better at software engineering than any statistician.
— JosH100 (@josh_wills) May 3, 2012
In addition to creating a high-barrier to entry, these skills enabled data scientists to build predicitive models, measure casuality and find patterns in data. Of these, predicitive modeling paid best. Companies later peeled that work off into a new title: Machine Learning Engineer (“MLE”).3
For years, shipping AI meant keeping data scientists and MLEs on the critical path. With LLMs, this stopped being the default. Foundation-model APIs now allow teams to integrate AI independently.
Getting cut out of the loop rattled data scientists and MLEs I know. If the company no longer needs you to ship AI, it is fair to wonder whether the job still has the same upside. The harsher story people tell themselves: unless you are pretraining at a foundation-model lab, you are not where the action is.
I read it the other way. Training models was never most of the job. The bulk of the work is setting up experiments to test how well the AI generalizes to unseen data, debugging stochastic systems, and designing good metrics. Calling an LLM over an API does not make this work go away.
I recently gave a talk titled “The Revenge of the Data Scientist” at PyAI Conf to make that case with examples rather than assertion alone. Below is an annotated version of that presentation.
The Harness Is Data Science
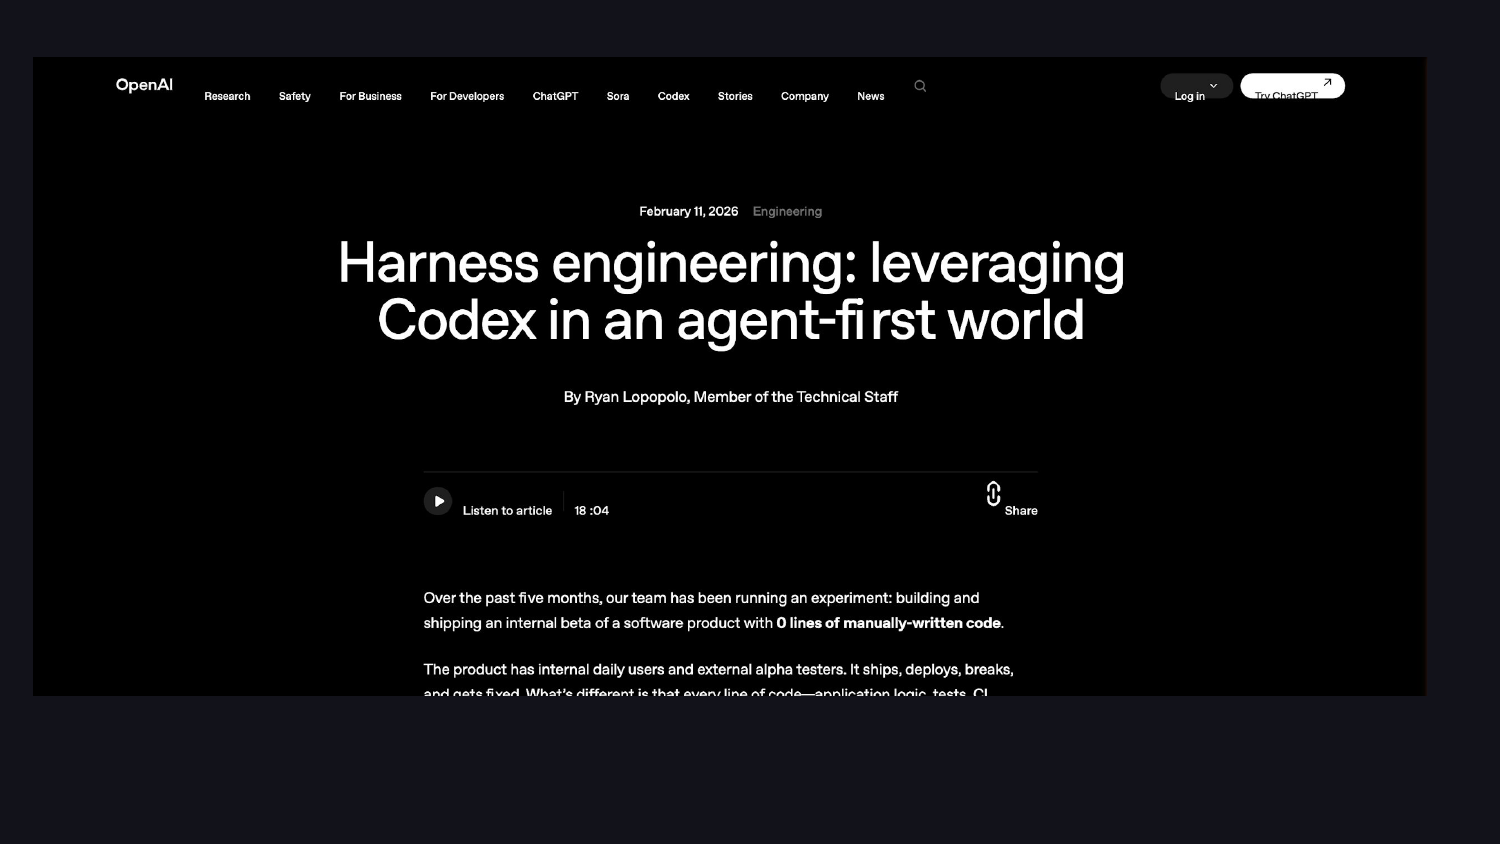
OpenAI published a blog post on harness engineering that I recommend reading. They describe how Codex worked on a software project for months, autonomously, with agents developing code bounded by a harness of tests and specifications.
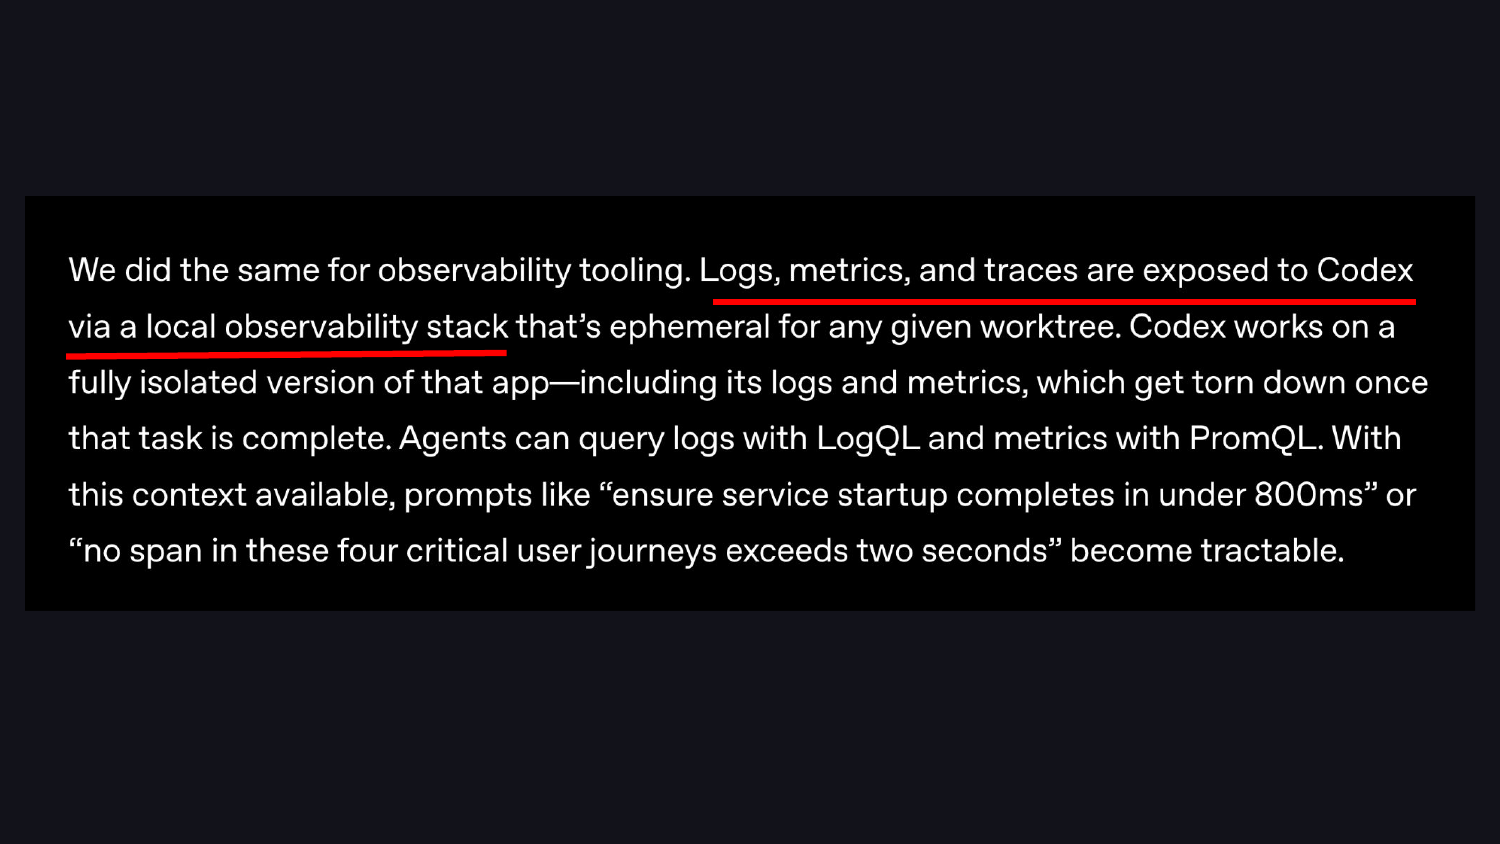
One detail in that blog post is easy to miss. The harness includes an observability stack: logs, metrics, and traces exposed to the agent so it can tell when it is going off track. In addition to tests and specifications, there are metrics. That is a key component of the system.
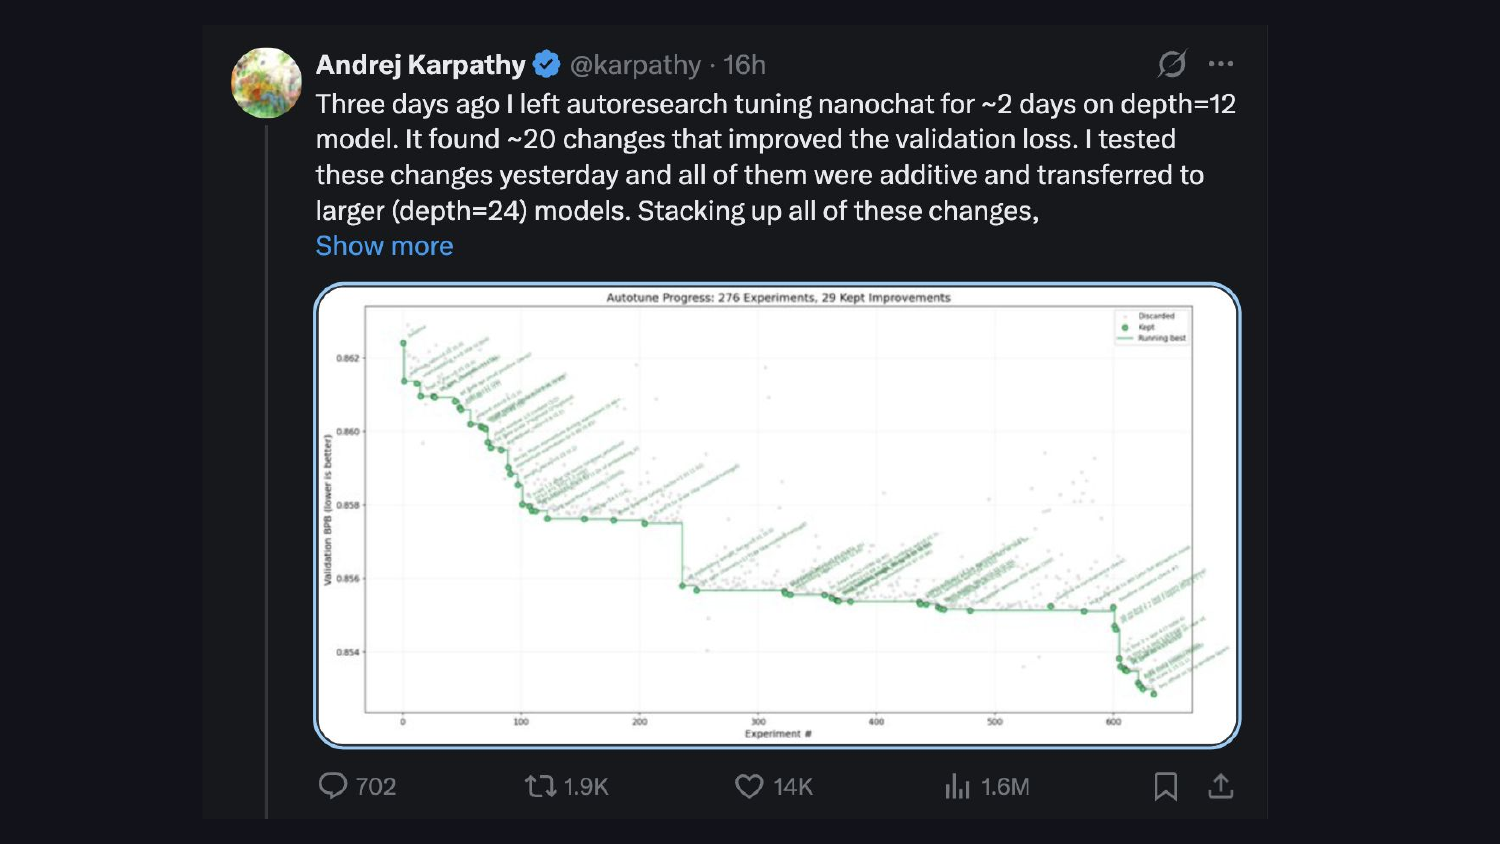
Andrej Karpathy’s auto-research project shows the same pattern: models iteratively optimize against a validation loss metric. Same idea, different harness.
What I want to convince you of is that a large portion of the harness is data science.
Let’s take a step back and take stock of where we are.
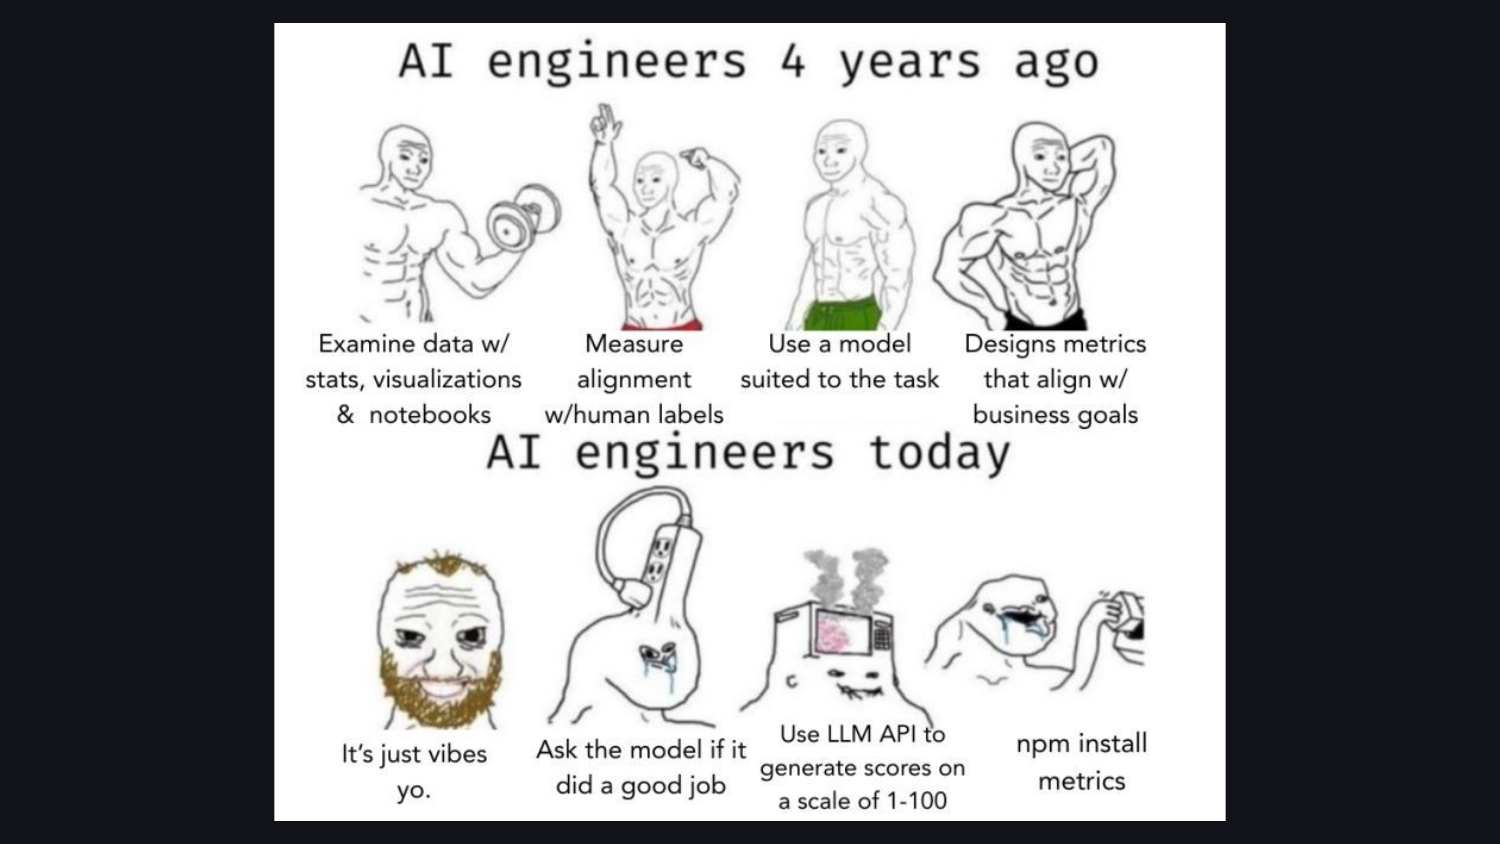
Years ago, practitioners spent hours examining data, checking label alignment, and designing metrics. Today, we build on “vibes,” ask the model if it did a good job, and grab off-the-shelf metric libraries without looking at the data.
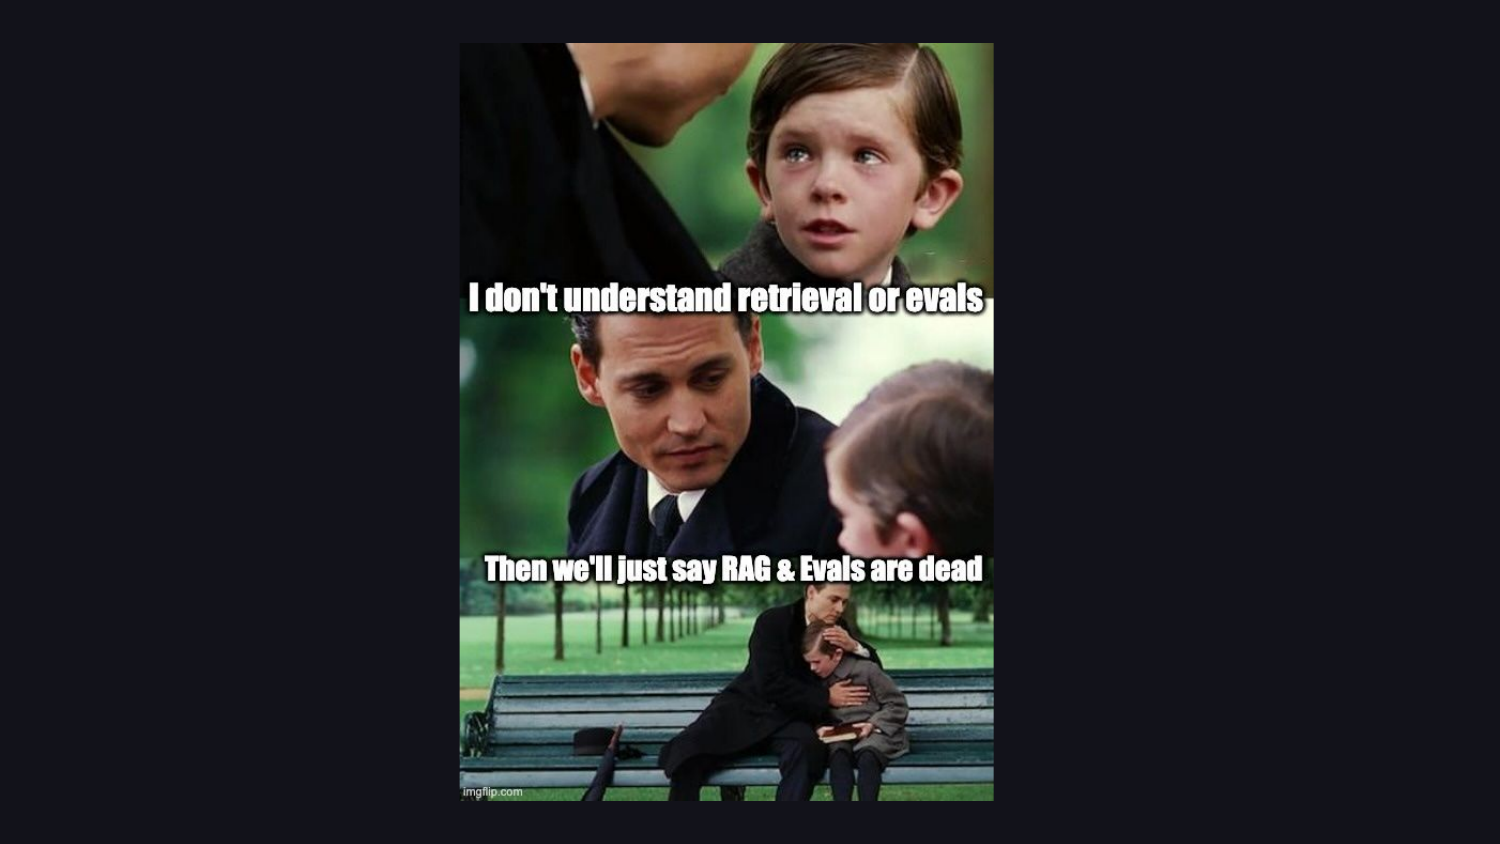
This shows up most around retrieval and evals. Without a data background, engineers fear what they don’t understand. They claim “RAG is dead” or “evals are dead,” yet build systems that depend on those concepts.
The rest of this post walks through five eval pitfalls I see repeatedly, and what a data scientist would do differently in each case.
Generic Metrics
The first pitfall is generic metrics.
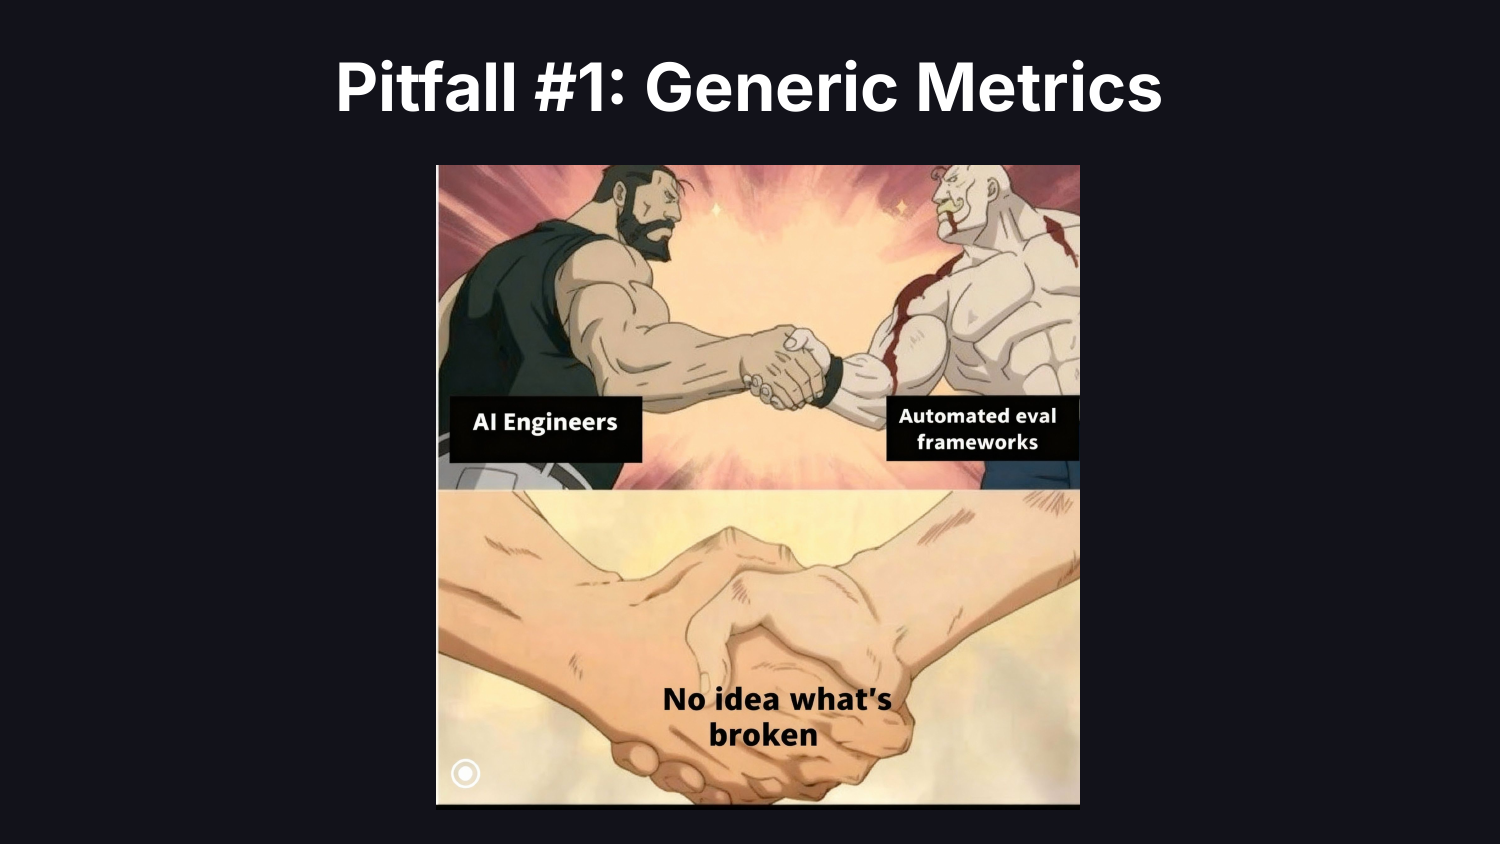
It is tempting to reach for an eval framework and use its metrics off the shelf. The problem: you have no idea what is actually broken. Most teams put up a dashboard with helpfulness scores, coherence scores, hallucination scores. These sound reasonable. They are also generic enough to be useless for diagnosing your application’s failures.
A data scientist would not adopt metrics off the shelf. They would explore the data, explore the traces, ask “what is actually breaking here?”, and figure out the highest-value thing to start measuring. There are infinite things to measure. You have to form hypotheses and iterate.
The best medicine for this pitfall is looking at the data.
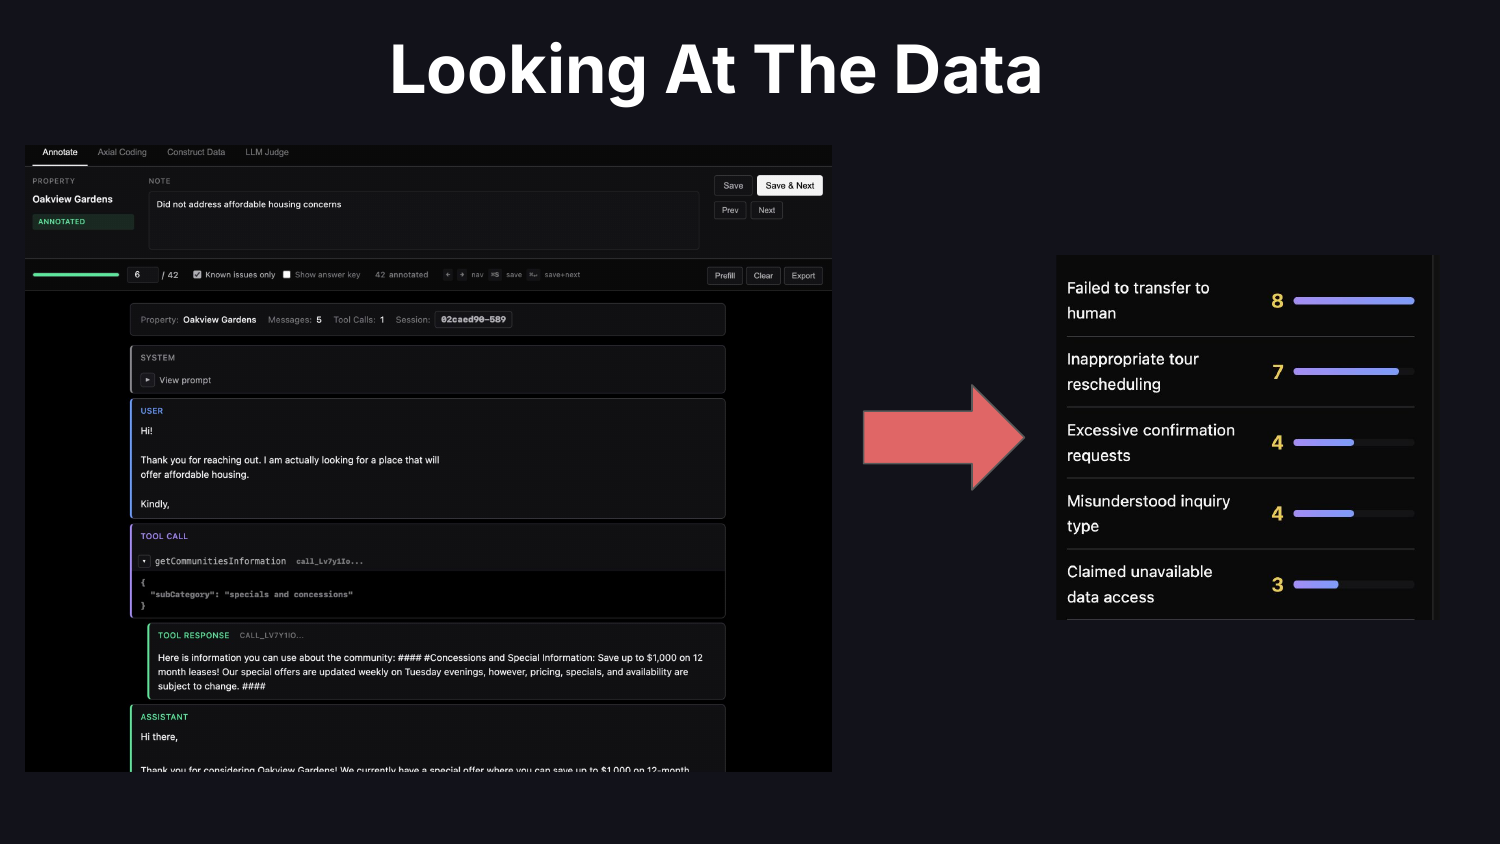
What does “looking at the data” mean in practice? It means reading traces. Code your own custom trace viewer so you can remove friction and customize the display for your domain’s quirks. Take notes on problems you find. Do error analysis: categorize failures, figure out what to prioritize, decide what to work on.
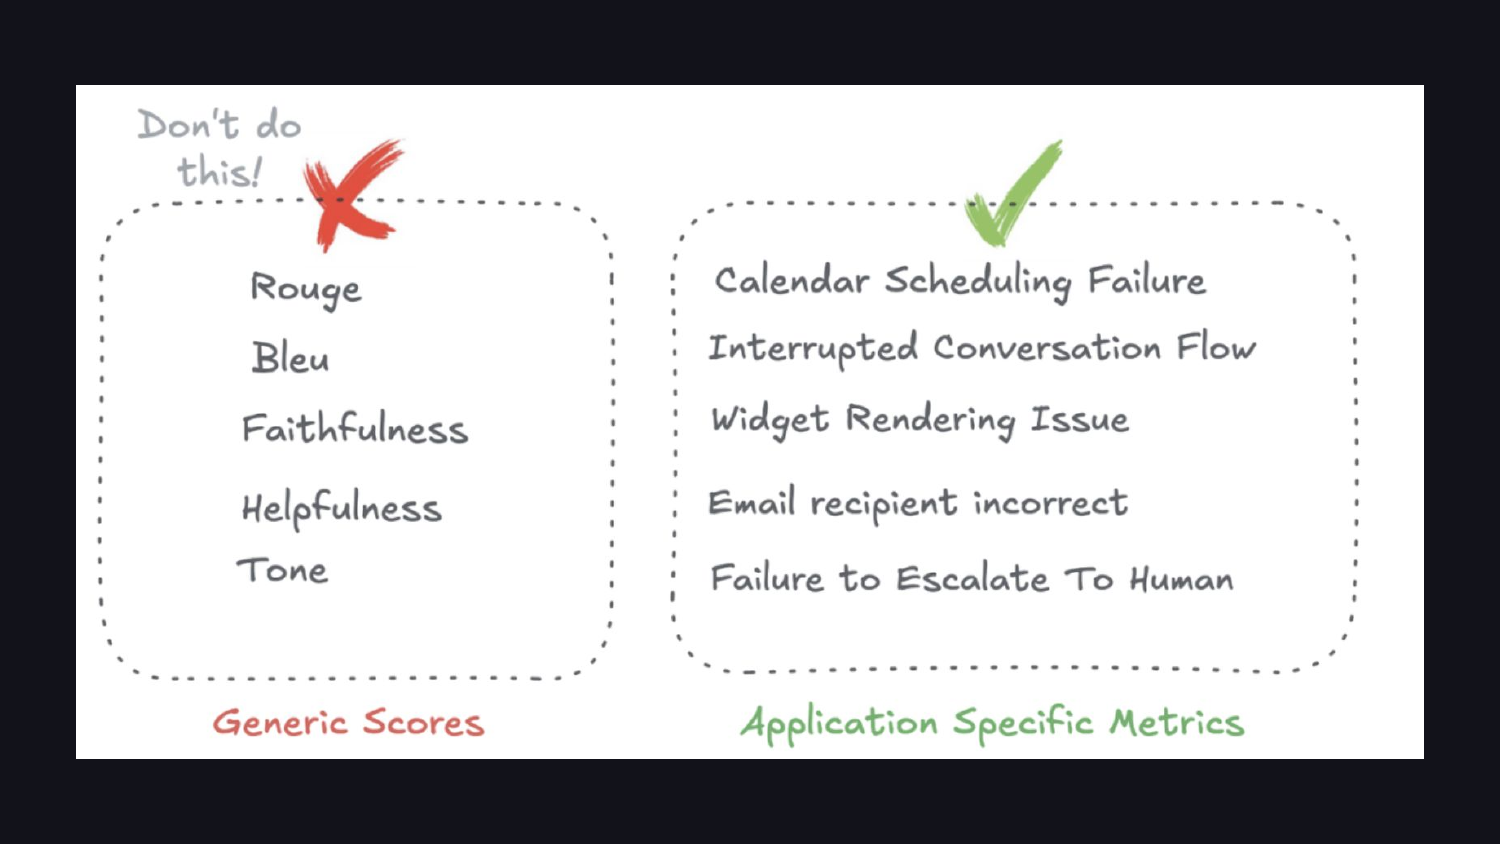
When you look at your data, you end up driving toward application-specific metrics. Off-the-shelf similarity metrics like ROUGE or BLEU rarely fit LLM outputs. The metrics that matter look like “Calendar Scheduling Failure” or “Failure to Escalate To Human.”

If there is one thing to take away from this post: look at the data. How to look at it is a separate question and takes practice. This is the higest ROI activity you can engage in and is often skipped.
Unverified Judges
The second pitfall is unverified judges. A lot of teams use an LLM as a judge to figure out whether their AI is working. Most of the time, nobody has a good answer to “how do you trust the judge?”
The default: ask an LLM to rate outputs on a scale and use the numbers. A data scientist would treat the judge like a classifier. You have a black box giving you a prediction. How do you trust it? Get human labels, partition the data into train/dev/test, and measure whether the classifier is trustworthy.
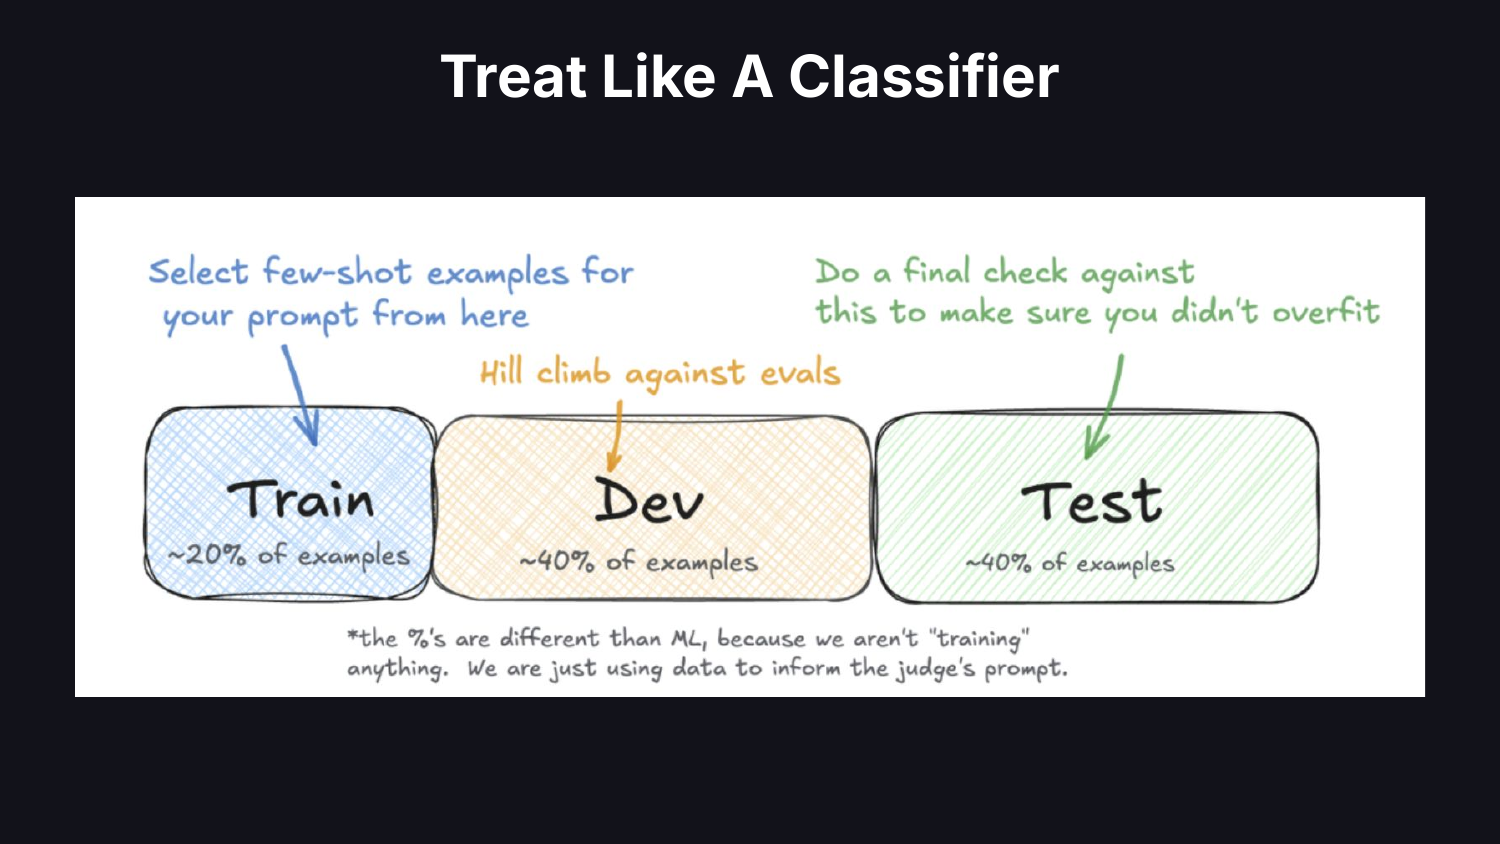
Source few-shot examples from your training set. Hill-climb your judge’s prompt against a dev set. Keep a test set aside to confirm you haven’t overfit. If you have done machine learning before, this is boring. But people are not doing it. Verifying classifiers has become a lost art in modern AI.
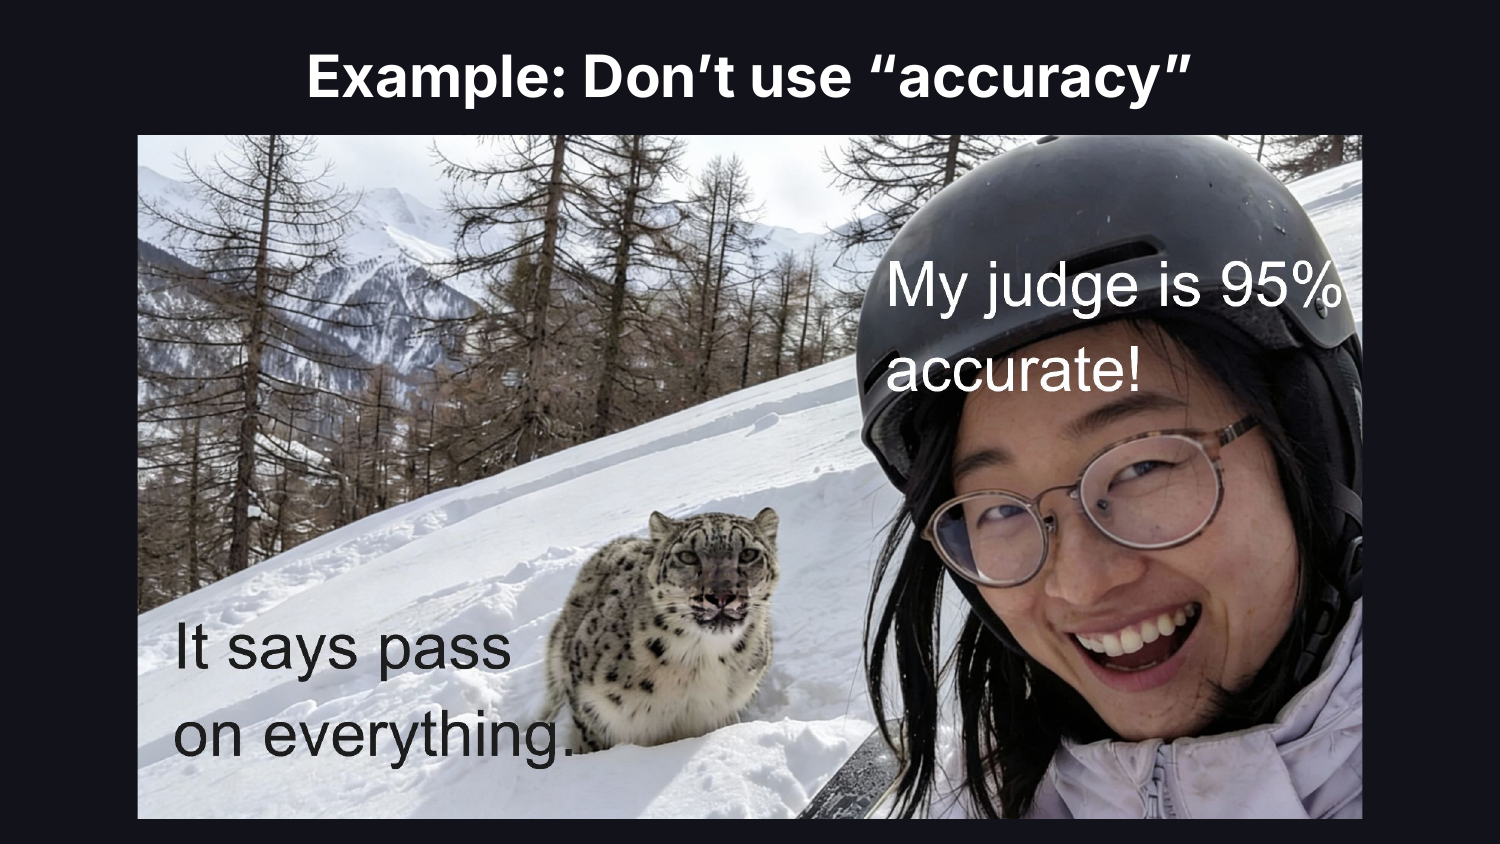
Treat your judge like a classifier in how you report results, too. Everywhere I go I see accuracy reported. If a failure mode occurs 5% of the time, accuracy hides the system’s true performance. Use precision and recall.
Bad Experimental Design
The third pitfall is experimental design. There are many dimensions to this. Here are two that come up most.
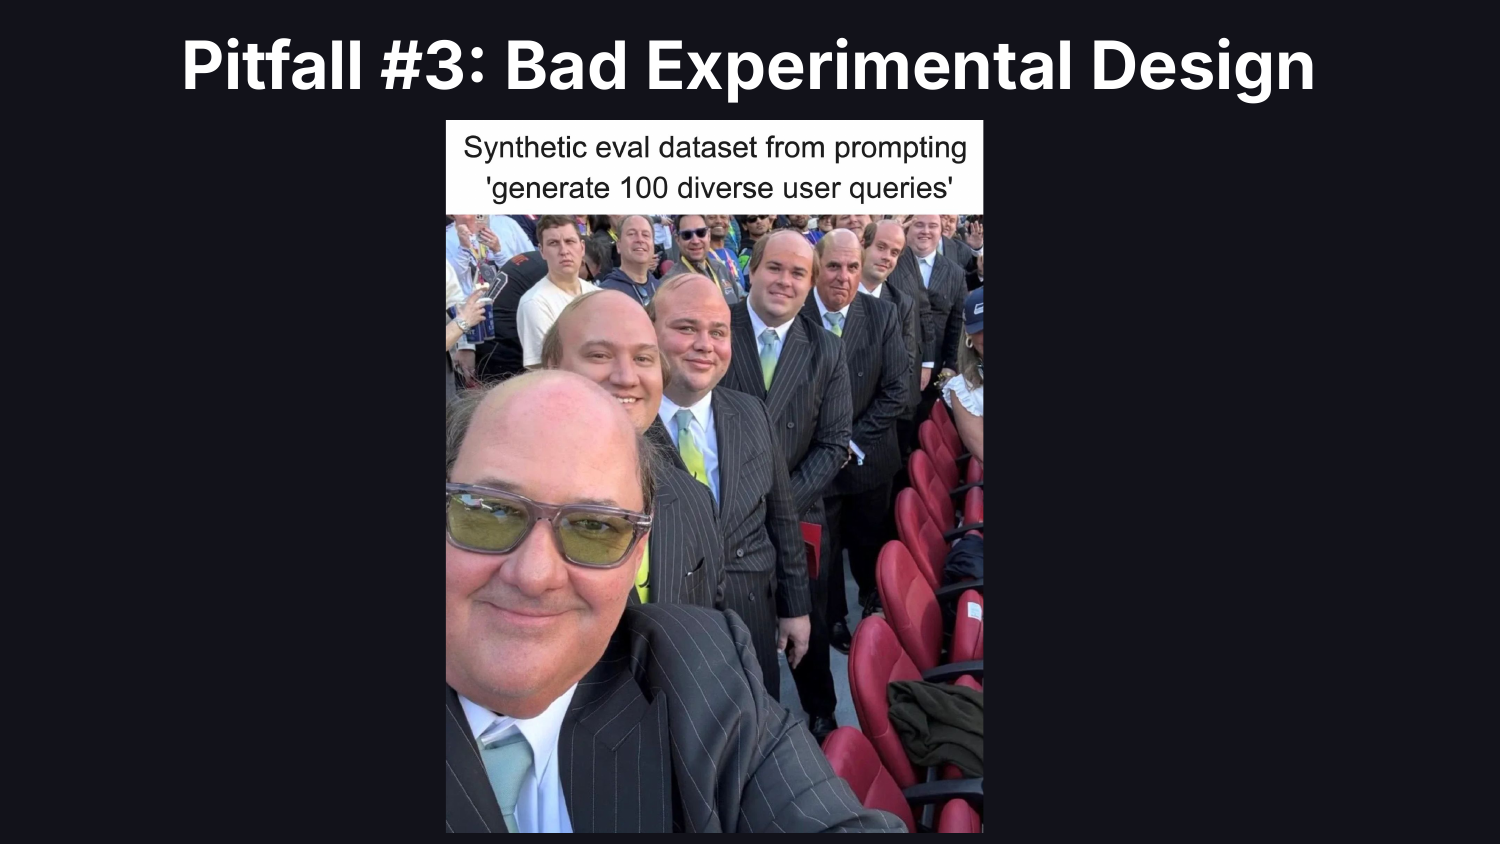
The first is constructing test sets. Most teams generate synthetic data by prompting an LLM: “Give me 50 test queries.” They get generic, unrepresentative data. A data scientist would look at real production data first, use hypotheses to determine which dimensions matter, then generate synthetic examples along those dimensions.
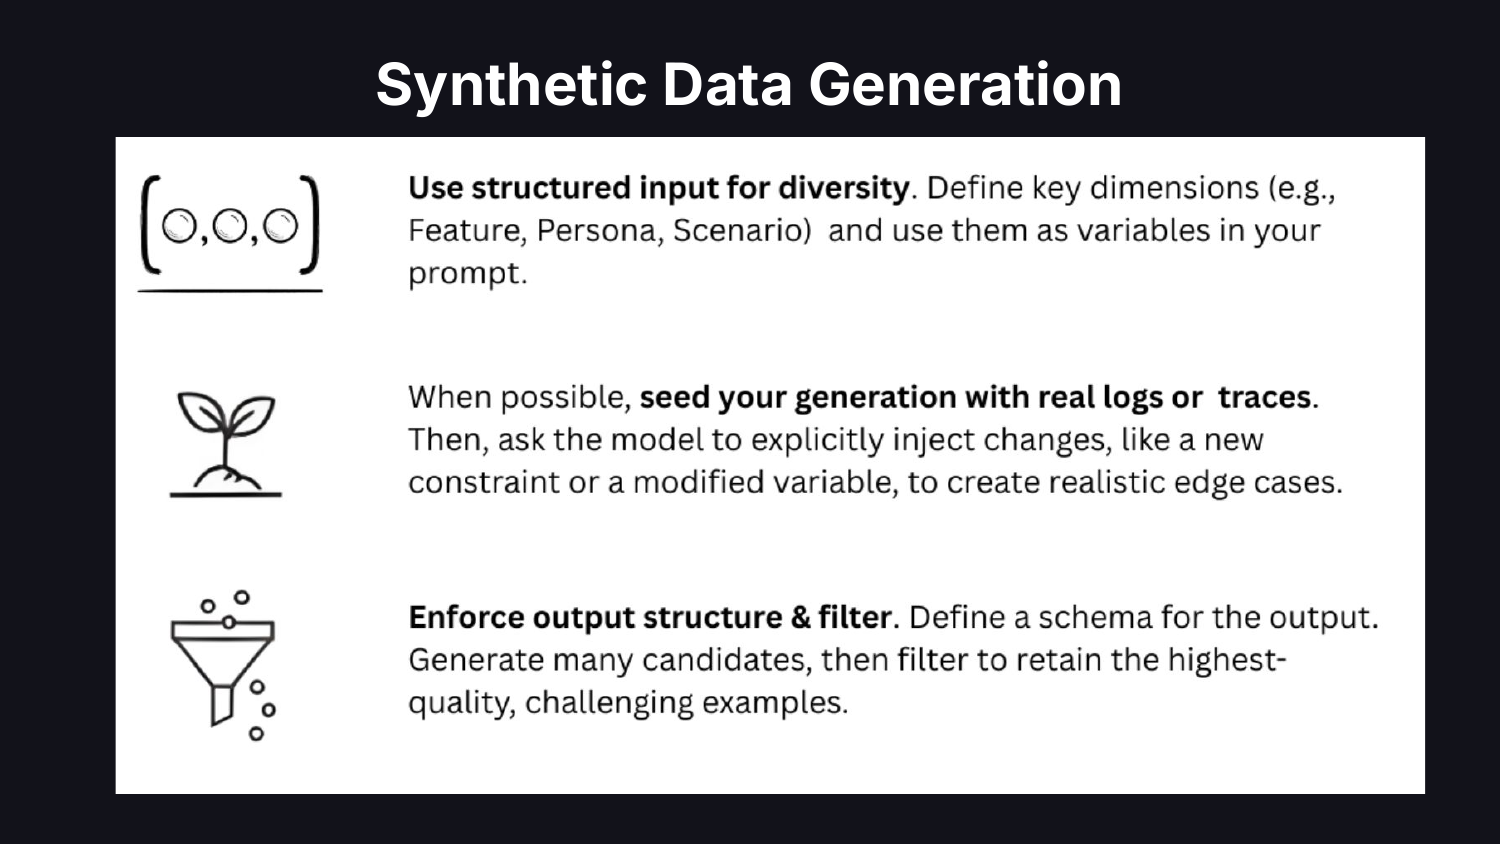
Ground synthetic data in real logs or traces. Figure out what dimensions to vary. Inject edge cases. Base the synthetic data off real data.
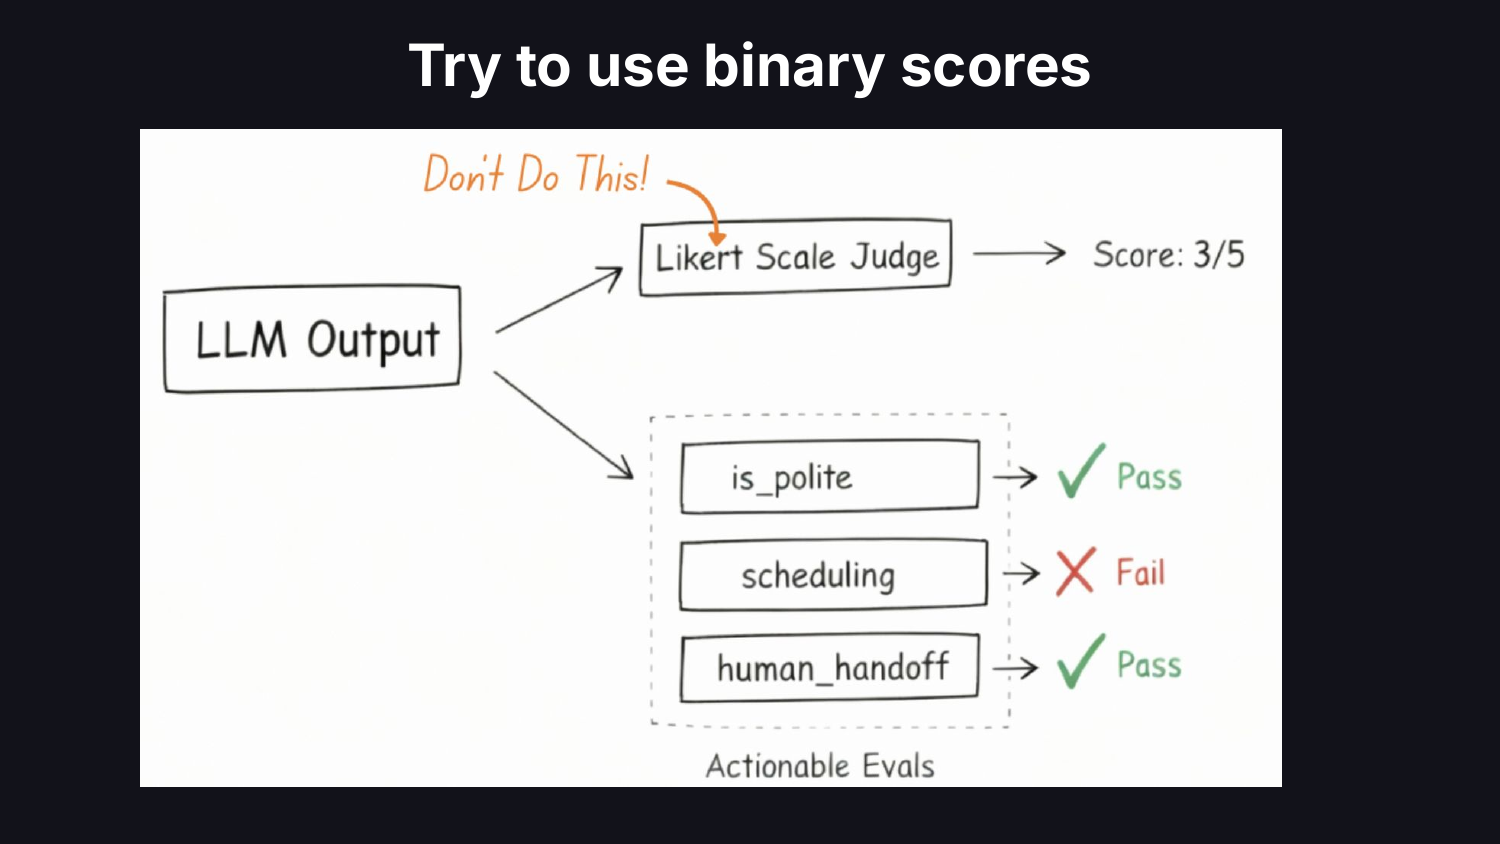
The second is metric design. Teams bundle entire rubrics into a single LLM call and default to 1-5 Likert scales. A data scientist would reduce complexity, make each metric actionable, and tie it to a business outcome. Replace subjective scales with binary pass/fail on scoped criteria. Likert scales hide ambiguity and kick the can down the road on hard decisions about system performance.
Bad Data and Labels
The fourth pitfall is bad data and labels. Data scientists don’t trust the data. They don’t trust the labels. They don’t trust anything. They are skeptical by training. AI engineers at large have not built this muscle yet.
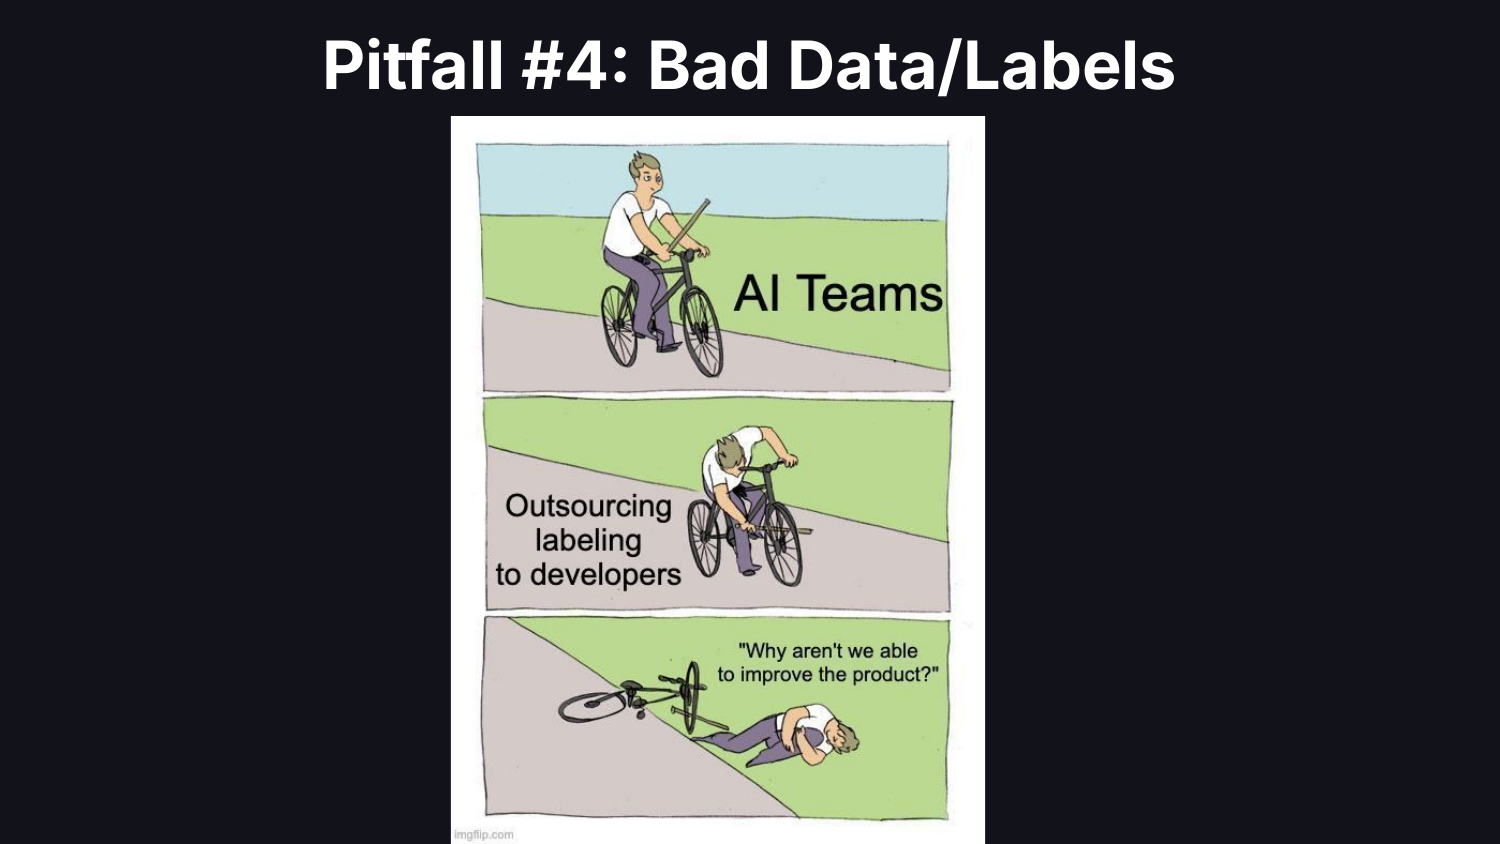
When it comes to labeling, most teams make it someone else’s problem. Labeling seems unglamorous, so it gets delegated to the dev team or outsourced. A data scientist would insist that domain experts label the data, stay skeptical of the labels, and look at the data.
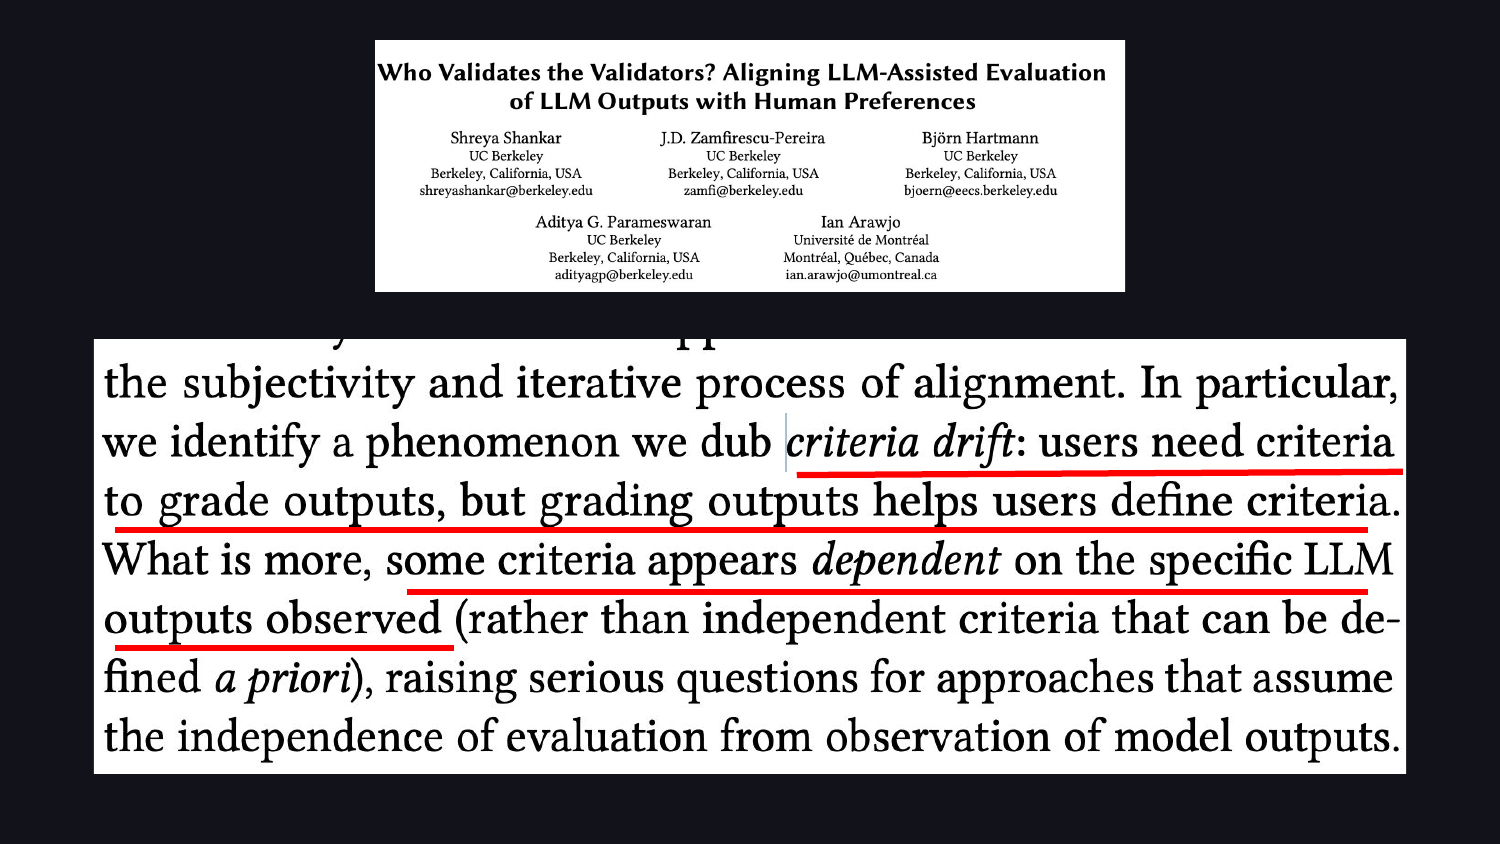
But labeling matters for a deeper reason than label quality. It is impossible to know what you want unless you look at the data. There is a concept called “criteria drift,” validated in a paper by Shreya Shankar and colleagues: users need criteria to grade outputs, but grading outputs helps users define their criteria. People don’t know what they want until they see the LLM’s outputs. The labeling process itself surfaces what matters.
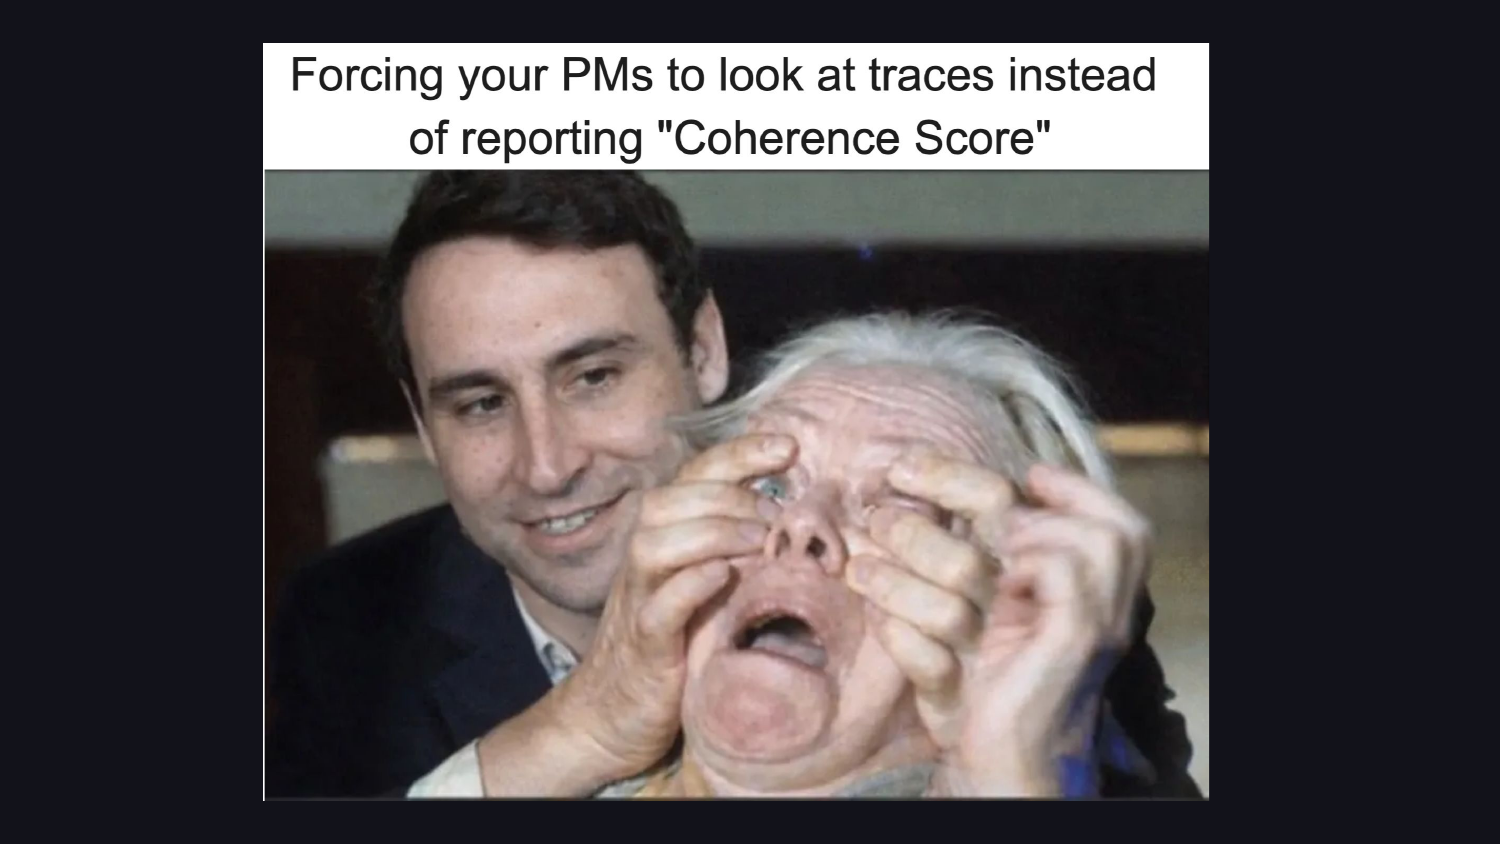
Data scientists champion this: get domain experts and product managers in front of raw data, not summary scores.
Automating Too Much
The fifth pitfall is automating too much. All of this is human work. The temptation is to automate it away.
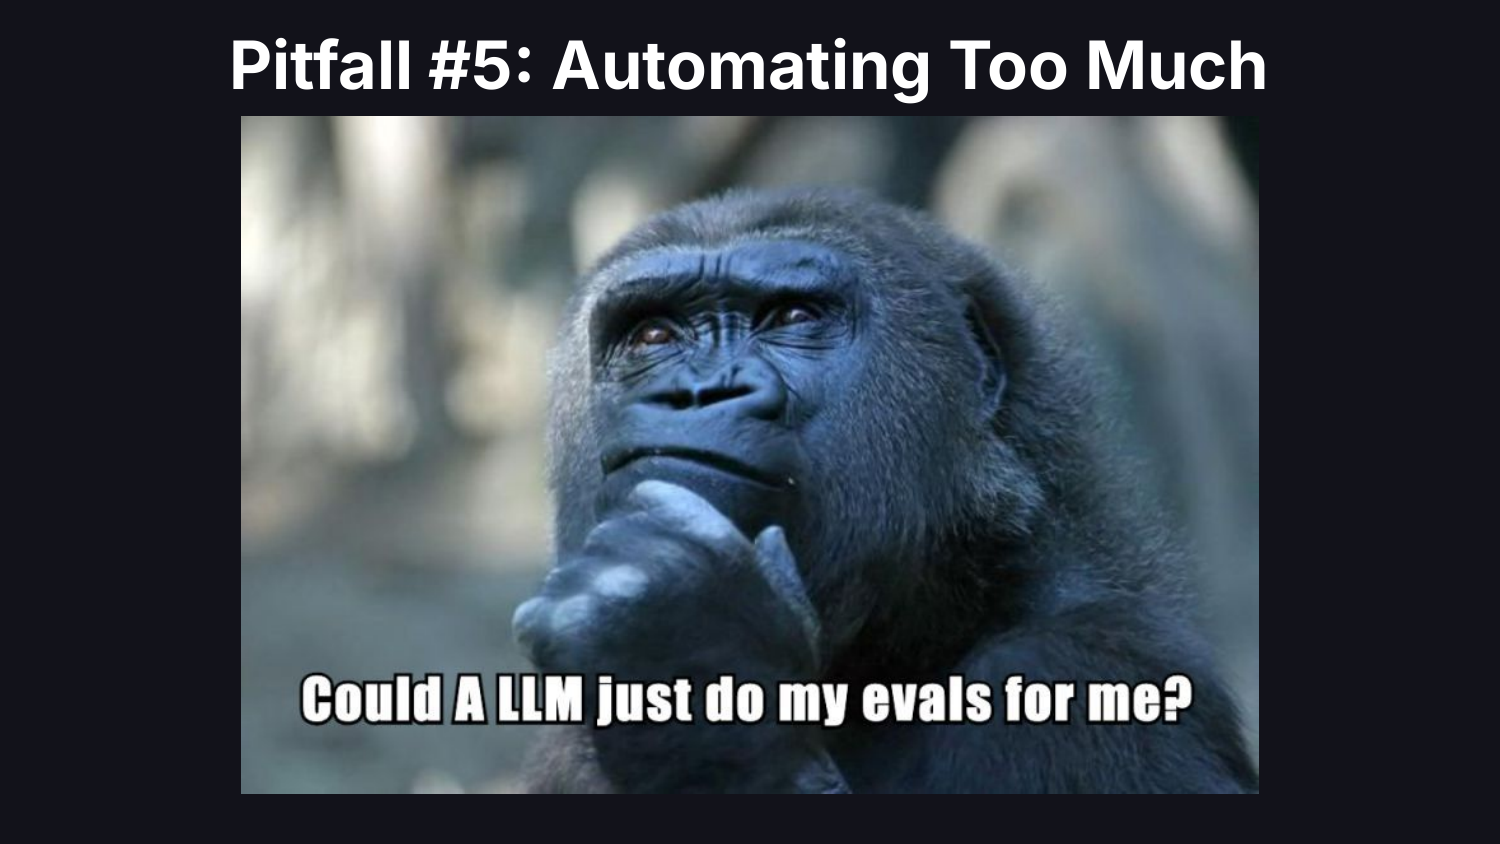
LLMs can help wire things up, write the plumbing, generate boilerplate for evaluations. They cannot look at the data for you, for the exact reason we just discussed: you don’t know what you want until you see the outputs.
Other Pitfalls
We did not have time to cover every pitfall. Here is a speed run through the rest.
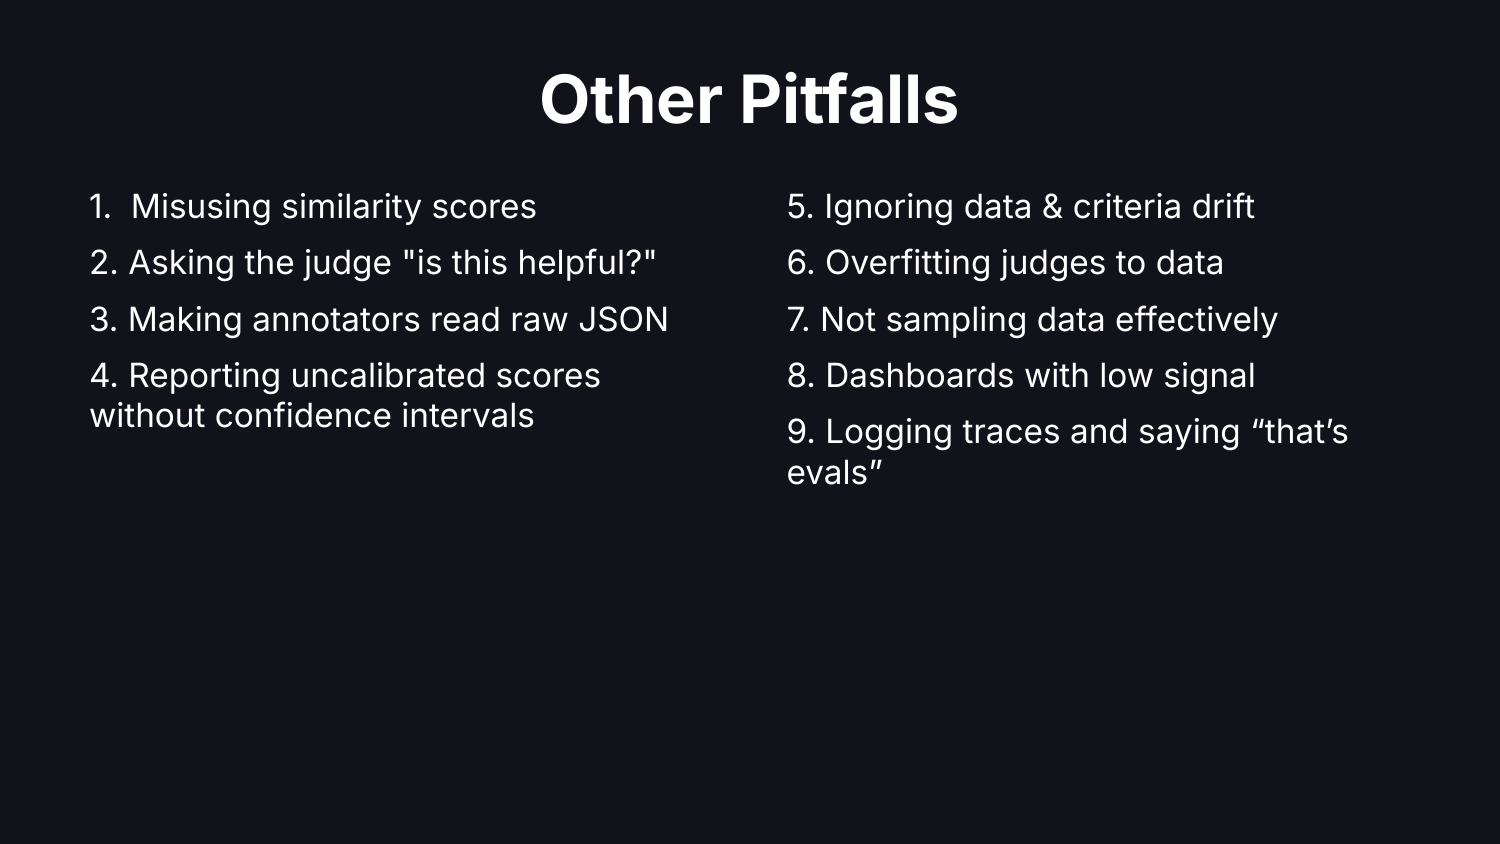
Misusing similarity scores. Asking the judge vague questions like “is it helpful?” Making annotators read raw JSON. Reporting uncalibrated scores without confidence intervals. Data drift, overfitting, not sampling correctly, dashboards that don’t make sense.
The Mapping
If you zoom out, every pitfall above has the same root cause: missing a data science fundamental.
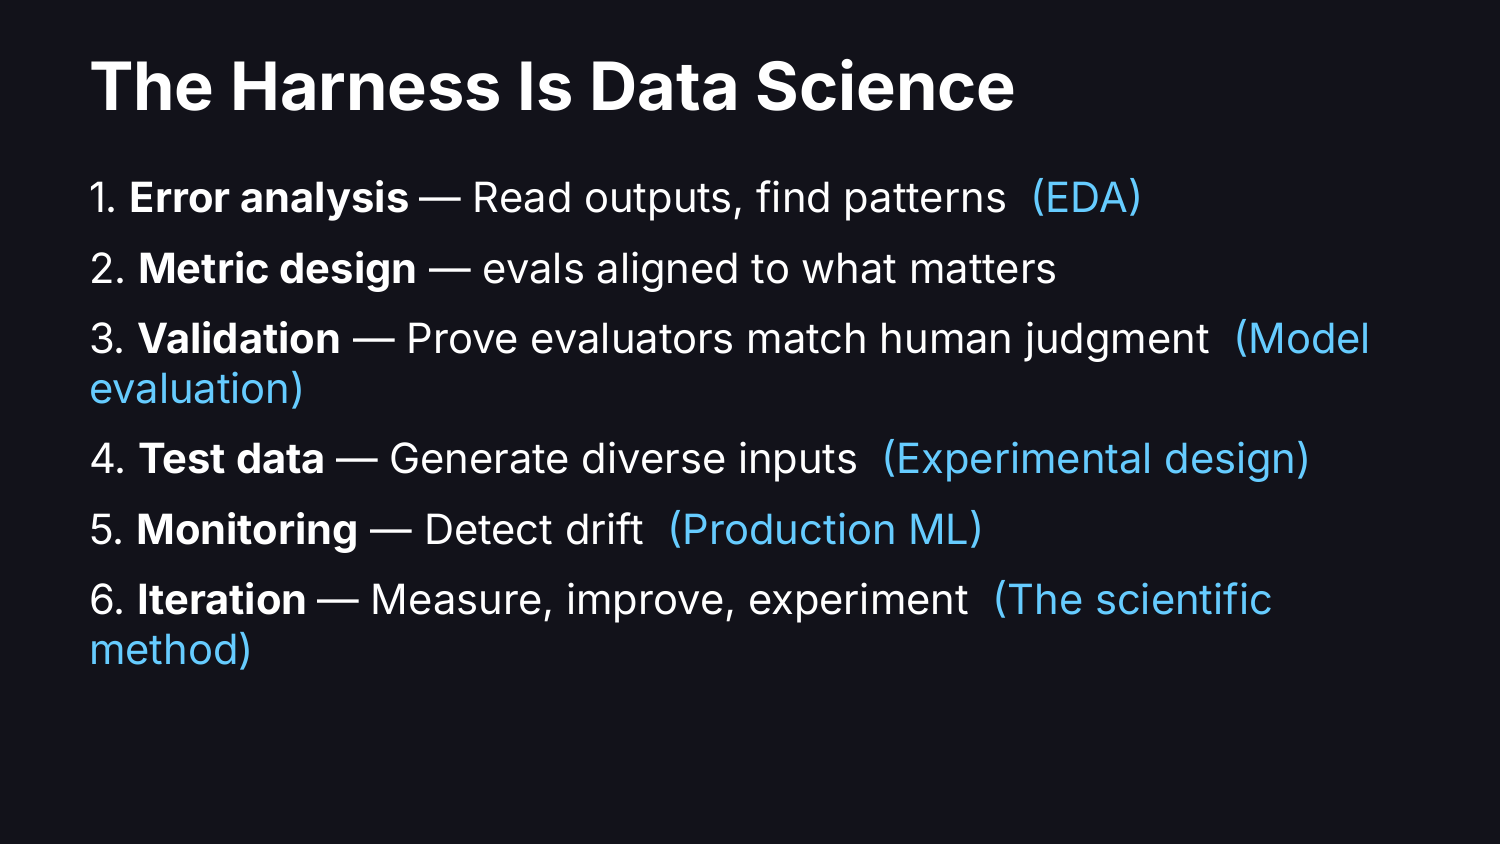
Reading traces and categorizing failures is Exploratory Data Analysis. Validating an LLM judge against human labels is Model Evaluation. Building representative test sets from production data is Experimental Design. Getting domain experts to label outputs is Data Collection. Monitoring whether your product works in production is Production ML. None of this is new. The names changed, the work did not.

This is a Python conference, so: Python remains the best toolset for looking at your data and dealing with data.
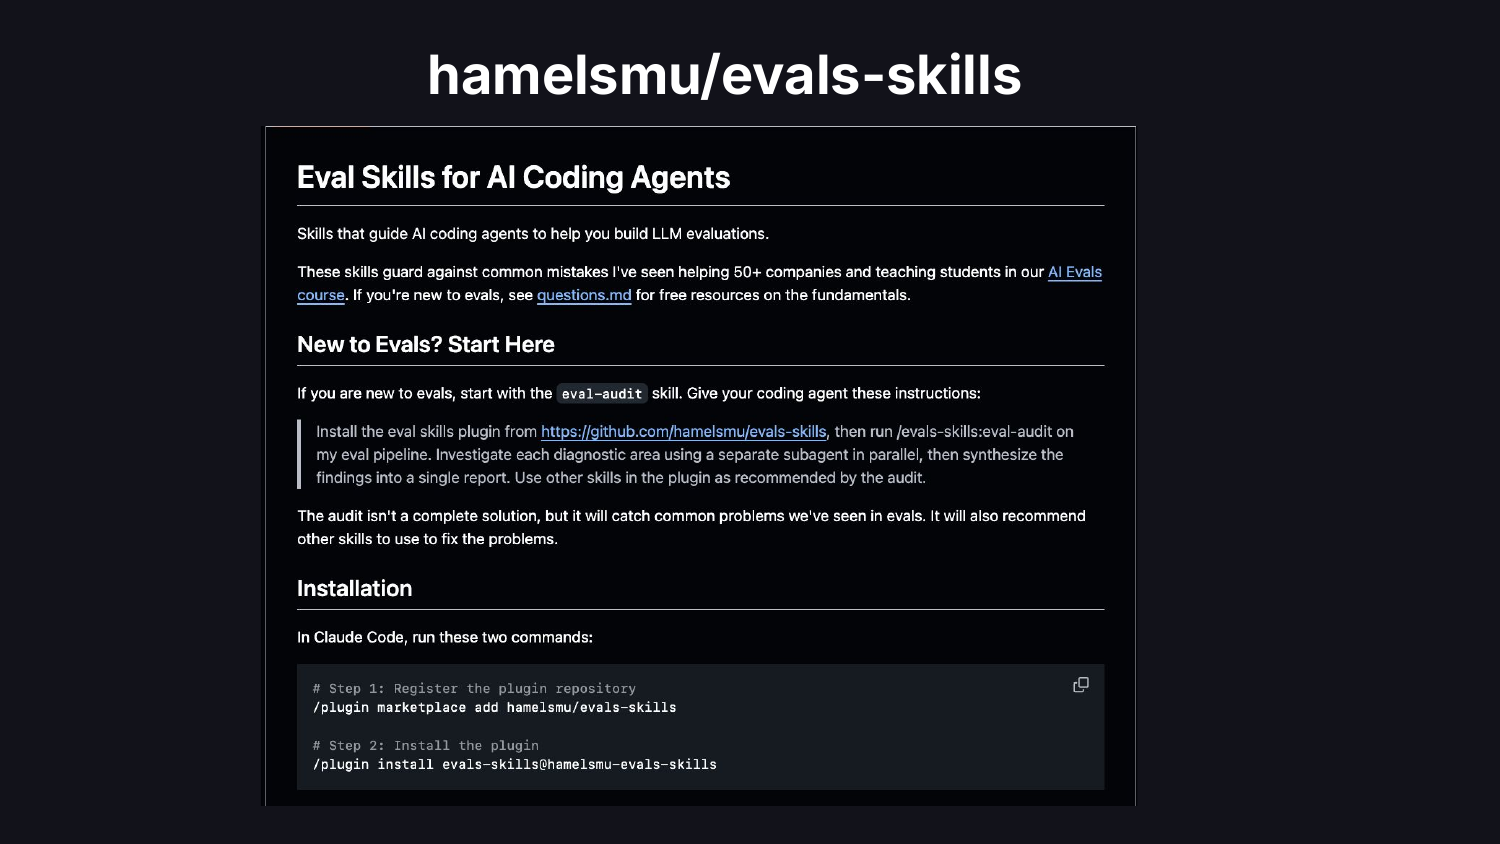
I built an open-source plugin that goes into more depth. Point it at your eval pipeline and it will tell you what you are doing wrong, or try its best to.
Always look at the data.
If you enjoyed the memes in this talk, there are many more on my website.
If you want to go deeper on any of these topics, the slides and video are below.
Thanks to Shreya Shankar and Bryan Bischof for many conversations that shaped this talk.
Video & Slides
Footnotes
https://hbr.org/2012/10/data-scientist-the-sexiest-job-of-the-21st-century↩︎
https://www.forbes.com/sites/louiscolumbus/2018/01/29/data-scientist-is-the-best-job-in-america-according-glassdoors-2018-rankings/↩︎
https://www.mckinsey.com/about-us/new-at-mckinsey-blog/ai-reinvents-tech-talent-opportunities↩︎